
The emphasis of this study was on developing a method of analysis for use in future research and to examine the changes in refraction for a sample of young adult myopes. The findings will be presented in visual form based on canonical precedent. Interaction between the variables and dynamic tendencies will be inferred from a visual analysis of the graphs and from statistical analysis. ‘This form of presentation also allows the opportunity to compare these results with results from past research in the field.
ANALYSIS MODEL
First the histograms of the distribution of refractive error of the three optometric populations and the subgroup sample will be compared to establish the credibility of the sample used in the study. Next, the data for the study sample will be displayed. The variables in this study include: age, refractive error (first refraction), refractive error (second refraction), and the interval between the data points. These will be displayed for the total population as well as for males and females separately. These results will be compared in several ways, i.e.., for refractive change, dioptric velocity and degree of refractive error, dioptric velocity and age, and dioptric velocity over time. ‘When appropriate, means, standard deviations., tests, and correlations will be computed. These results will also be compared with the historical data. The raw data is presented in Appendix Two.
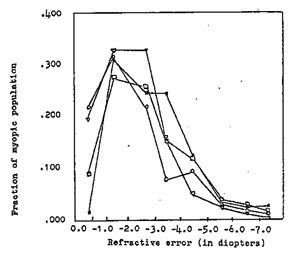
Figure 10 – Graphic Comparison of the Histograms of the Contributing Optometrist’s Myopic Populations
| Gottlieb n=442, | mean = -2.83 diopters, s.d. = 1.75 |
| o Gottlieb n=50, | mean = -2.65 diopters, s.d. = 1.73 |
| ° Campbell n=211, | mean = -2.40 diopters, s.d. = 1.75 |
| (triangle) Shipley n=99, | mean = -2.33 diopters, s.d. = 1.62 |
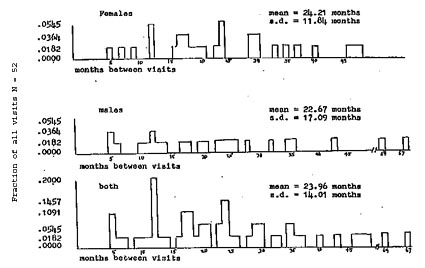
Figure 11 – Age distribution of the sample.
Histograms of female, male, and combined study population. For females: mean = 25.28 years, s.d. = 3.00; males: mean = 25.70 years, s.d. = 279; combined: mean = 25.49 years, s.d. = 2.90.
Figure 12 – Interval in months between first and second refraction.
Histogram shows the frequency distribution of the months between refractions for female, male, and combined sample. The distribution is similar for all three groupings. The approximate average is nearly two years.
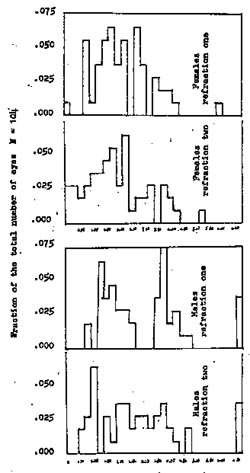
Figure 13 – Distribution of first and second refraction by gender
Histograms of refractive error, refraction one and two for females and males.
The mean refractive error was lowered between the second and first refraction by 0.29 diopters and 0.23 diopters for females and males respectively. First female mean = 2.28 ., s.d. = 1.26 , second mean = 1 .99 , s.d. = 1.31 First male mean = 3.09 , s.d. = 2.09, second mean = 2.86 , s.d. = 2.17.
Figure 13 is a histogram of the frequency distribution of the refractive error for females and males for the first and second eye examination. The female mean for the first data point was -2.28 ±1.26, for the second data point -1.99 ±1.31, for the first male data point -3.09 ±2.09, and for the second -2.86 ±2-71 diopters. The refractive error mean for females was lowered (less myopia) by 0.29 and for males by 0.23 diopters. Figure 14 is a similar graph for the total group. The mean for the first refraction was -2.65 ±1.73 and for the second was -2-39 ±1.80 diopters. The difference between the two means showed a decrease in myopia by 0.26 diopters over an average time interval of twenty-four months.
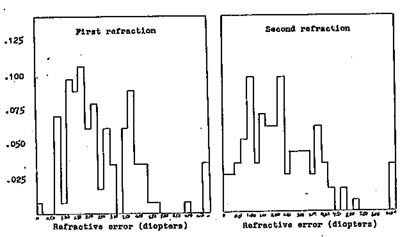
Figure 14 – Distribution of first and second refraction for the total sample.
The mean refractive error on the first visit was 2.65 diopters, s.d. 1.73, and 2.39 diopters, s.d. = 1.80 on the second visit. There was a decrease in myopia by 0.26 diopter over an average time interval of twenty-four months.
INFERENTIAL DATA
The following data will snow trends in refractive changes and interactions among the variables studied.
The frequency breakdown for refractive difference between the first and second refraction for male, female, and combined samples is displayed in Figure 15. There was no significant difference between the means of the females and males. if the means are compared with a dioptric change of zero (Hirsch, 1963) there is a significant difference at the .001 level of confidence. For females the mean was 0.29 ±0.49 diopters (t = 4.35, p .001), for males the mean was 0.23 ±0.48 diopters (t = 3.60, p .001), and for the total group the mean was 0.26 ±0.47 diopters of change (t = 5.76, P .001).
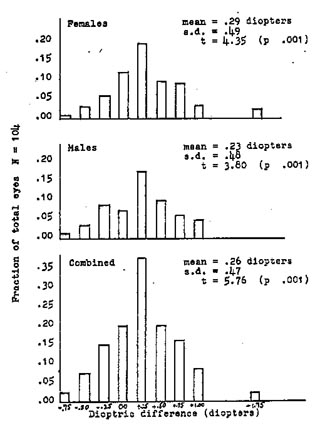
Figure 15 – Frequency distribution on of dioptric difference
between first and second refractions
Histograms display male, female, and combined frequency breakdown for dioptric change. Negative direction indicates increase in myopia,, Positive indicates decrease in myopia. All means are significantly different from zero (p .001). There was no significant difference between males and females.
Dioptric velocity, or refractive velocity, is a dynamic measure of the change in refractive error per time (months). This is a valuable means Of specifying refractive change because individuals or groups can be compared with each other or with control data after relatively short periods of time. This could be useful, for example, in experiments concerned with specific remedial techniques where it would be inefficient to wait for long periods of time for results. The rate of dioptric change for a given patient in routine refractions could also be compared with the expected velocity at the same age which might be useful in providing preventive or remedial information for patient counselling. The remainder of this chapter will explore dioptric velocity and its interaction with the variables of age, degree of refractive error, and the interval of time between eye examinations.
Figure 16 is a histogram displaying the dioptric velocity for the female,, male, and total samples. The means for each group will be compared with a refractive mean of zero rate of change. The mean for females was O.O18 ±.-033 diopters/month (t = 4.02, p .001), for males 0-019 ±0.038 diopters/month (t = 3.58, p .001), and for all 0.018 ±0.034 diopters/month (t = 5.38 p . 001). All groups were changing toward decreased myopia. There was no significant difference between males and females.
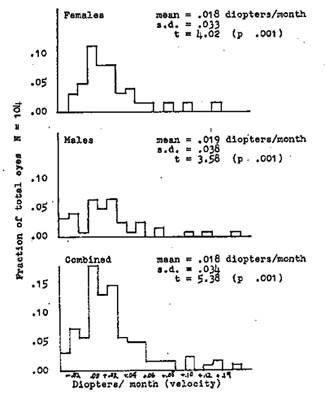
Figure 16 – Frequency distribution of dioptric velocity
The histograms show the distribution of the refractive error change per month between the first and second refractions. Negative diopters indicate increase in myopia, Positive indicate decreasing myopia. Comparison of the means for males and females showed no significant difference, but all groups were significantly different from Zero change at the .001 level of confidence (t test).
The relationship between patient age at the time of the first refraction and dioptric velocity is visible in the seatterplot in Figure 17. The grouping of data points appears
nearly random for female, male, and combined groups, with only a slight suggestion of an increase in velocity with increasing age. The correlation is not significant (correlation = .056).
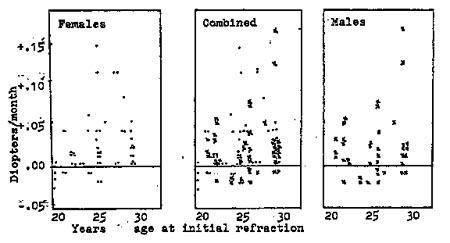
Figure 17 – Dioptric velocity and age
The dioptric velocity, change in diopters per month, is shown for females, males, and combined samples as it compares with the patient’s age at the time of the initial refractlion. Minus velocity indicates myopia, positive indicates decreasing myopia. Visual inspection of the scatterplots suggests that the older the patient, the more positive the velocity. The relationship was only moderate, however, correlation = .056, not significant.
The interaction between the magnitude of the refractive error (first refraction) and velocity is more apparent as suggested in Figure 18 and Figure 19. Dioptric velocity increases (toward decreased myopia) with increasing refractive error, but only moderately. The correlation of .64 is significant only at the .07 level of confidence for the total group.
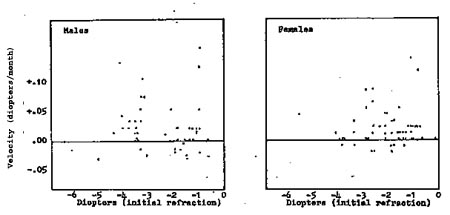
Figure 18 – Relationship between dioptric velocity and refractive error (gender)
The refractive error measured at the first examination is plotted with respect to the dioptric velocity for males and females. Positive velocity indicates decreasing myopia, negative indicates increasing myopia. Each dot represents one eye.
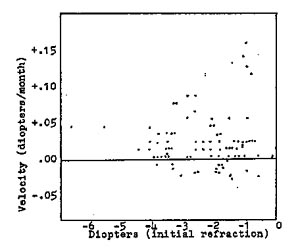
Figure 19 – Relationship between dioptric velocity and refractive error (total group)
Scatterplot of the total group suggests that the larger the initial refractlion, the greater the velocity towards decreased myopia The correlation is moderate, correlation = .64, significant at the p = .07 level. Negative indicates increasing myopia, positive decreasing myopia. Each dot represents one eye.
Figure 20, for females and males, and Figure 21, for the total sample, are scatterplots showing the relationship between the interval of time (months) between the first and the second refractive examination and the dioptric velocity. lt is apparent from the graphs that the largest velocity (decrease in myopia) happened within the period of time just following the first refractive examination. The correlation of .22 is significant (p .05) for the Combined group appear similar, the velocity approaches zero at about two years and seems to be most rapid before ten months.
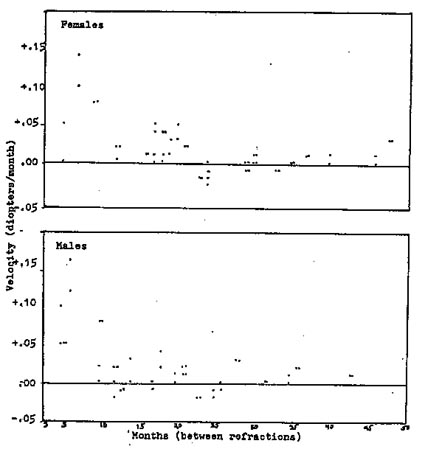
Figure 20 – Dioptric velocity related to interval between refractions for males and females
The change in diopters per month is plotted with respect to the time in months between the first and second refraction. Each point represents one eye. The minus velocity represents increasing myopia, plus velocity represents decreasing velocity.
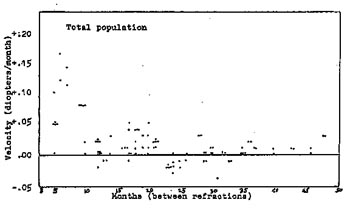
Figure 21 – Dioptric velocity related to interval between refractions, total group
The change in diopters per month is plotted with respect to the time, in months, between the first and second refraction. Each point represents one eye. Minus velocity represents increasing myopia, plus represents decreasing velocity.
Visual inspection suggests that the greatest change takes place in the beginning months after refraction. The correlation is .22 significant at p = .05.
In the last two graphs the trajectory of each eye of all the patients is plotted. The trajectory is a line drawn between the data point for the refractive error at the age of the patient at the time of the first examination and the data point for the second examination. The male and female characteristics are plotted in Figure 22 for the total sample in Figure 23. These graphs show the information contained in all of the other Figures in this Chapter. Visual inspection of the trajectories shows
the number of patients at each age, the average and dispersion of the initial and Subsequent refractive error for the samples, the decrease in myopia, the refractive velocity (slope of the lines), the velocity compared with age, the velocity compared with the amount of refractive error, and the velocity with respect to interval (horizontal distance between data points). In addition, the relationship between the two eyes for each patient can be observed. When two trajectory lines start at the same age and end at the same age, they represent two eyes for one patient. Some trajectories are parallel and close together indicating that both eyes were of similar refractive error and changed in a similar way. In some cases one eye has a much greater refractive error than its partner, but both change in a parallel fashion. in other cases the pair of lines for a given patient diverge away or converge towards each other with time, indicating that the eyes were becoming less or more similar respectively. Some patients eyes are widely different, others only slightly different from each other.
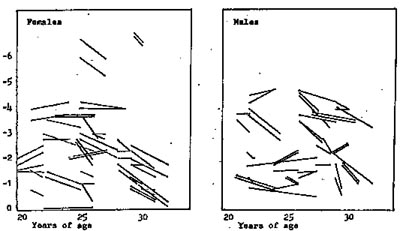
Figure 22 – Trajectories of refractive error at age for males and females
Each eye at each ago (at the time of refraction) is plotted for refractive error and the two points for each eye are then joined with a line.
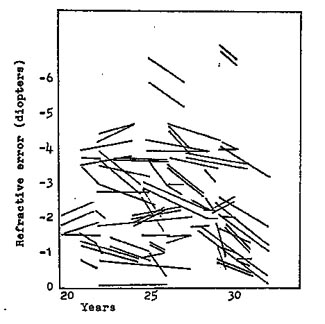
Figure 23 – Trajectories of refractive error at age total group
Each eye at each age (at the time of refraction) is plotted for refractive error and the two points for each eye are then joined with a line.
SUMMARY OF THE FINDINGS
A comparison of the frequency distribution of refractive errors for the study sample with those or other samples showed that there was a similar distribution of refractive errors for all the populations studied. This established the credibility of the study sample. Summary data showed little difference between males and females. Average age for the total sample was 25.49 ±2.90 years. Average interval between the first and second refractions was 23.96 ±14.01 months. The mean refractive error for females was -2.26 ±1.26, for males was -3.09 ±2.09, and for the total was -2.65 ±1.73 diopters.
Inferential data showing the trends in refractive changes and interactions among the variables was examined next. There was little difference between the genders. The average refractive error changed towards less myopia by 0.26 ±0.47 diopters. A test comparing the mean changes with zero change was significant at the .001 level or confidence. The rate of change per month (dioptric velocity) for the sample was 0.018 ±0.034 diopters/month which was significantly different from zero rate of change (p .001). The correlation between dioptric velocity and age was not significant, but the rate was slightly higher with increase in age. Dioptric velocity correlated at the .64 level with amount of refractive error, but the significance was only .07. The greater the refractive error, the greater was the rate of decrease in myopia. The interval (time between exams) was correlated (.22, p .05) with dioptric velocity. The greatest rate of change occurred within the first ten months following
the initial refraction. Inspection of trajectory lines plotted for each sample group snowed the relationships between the variables already mentioned and the similarities and differences between the two eyes of each patient. A variety of responses were described.
The implications of these findings and the use of this method of analysis will be discussed further in Chapter Five.